UX Design Deliverables
Learn the maps, personas, flows, wireframes, prototypes and reports UX designers create.
UX designers create artifacts that help teams understand people and plan the experience. This lesson follows one example, a community pottery workshop, through twelve common UX deliverables, from early mind maps and personas to wireframes, prototypes and usability reports.
Mind map
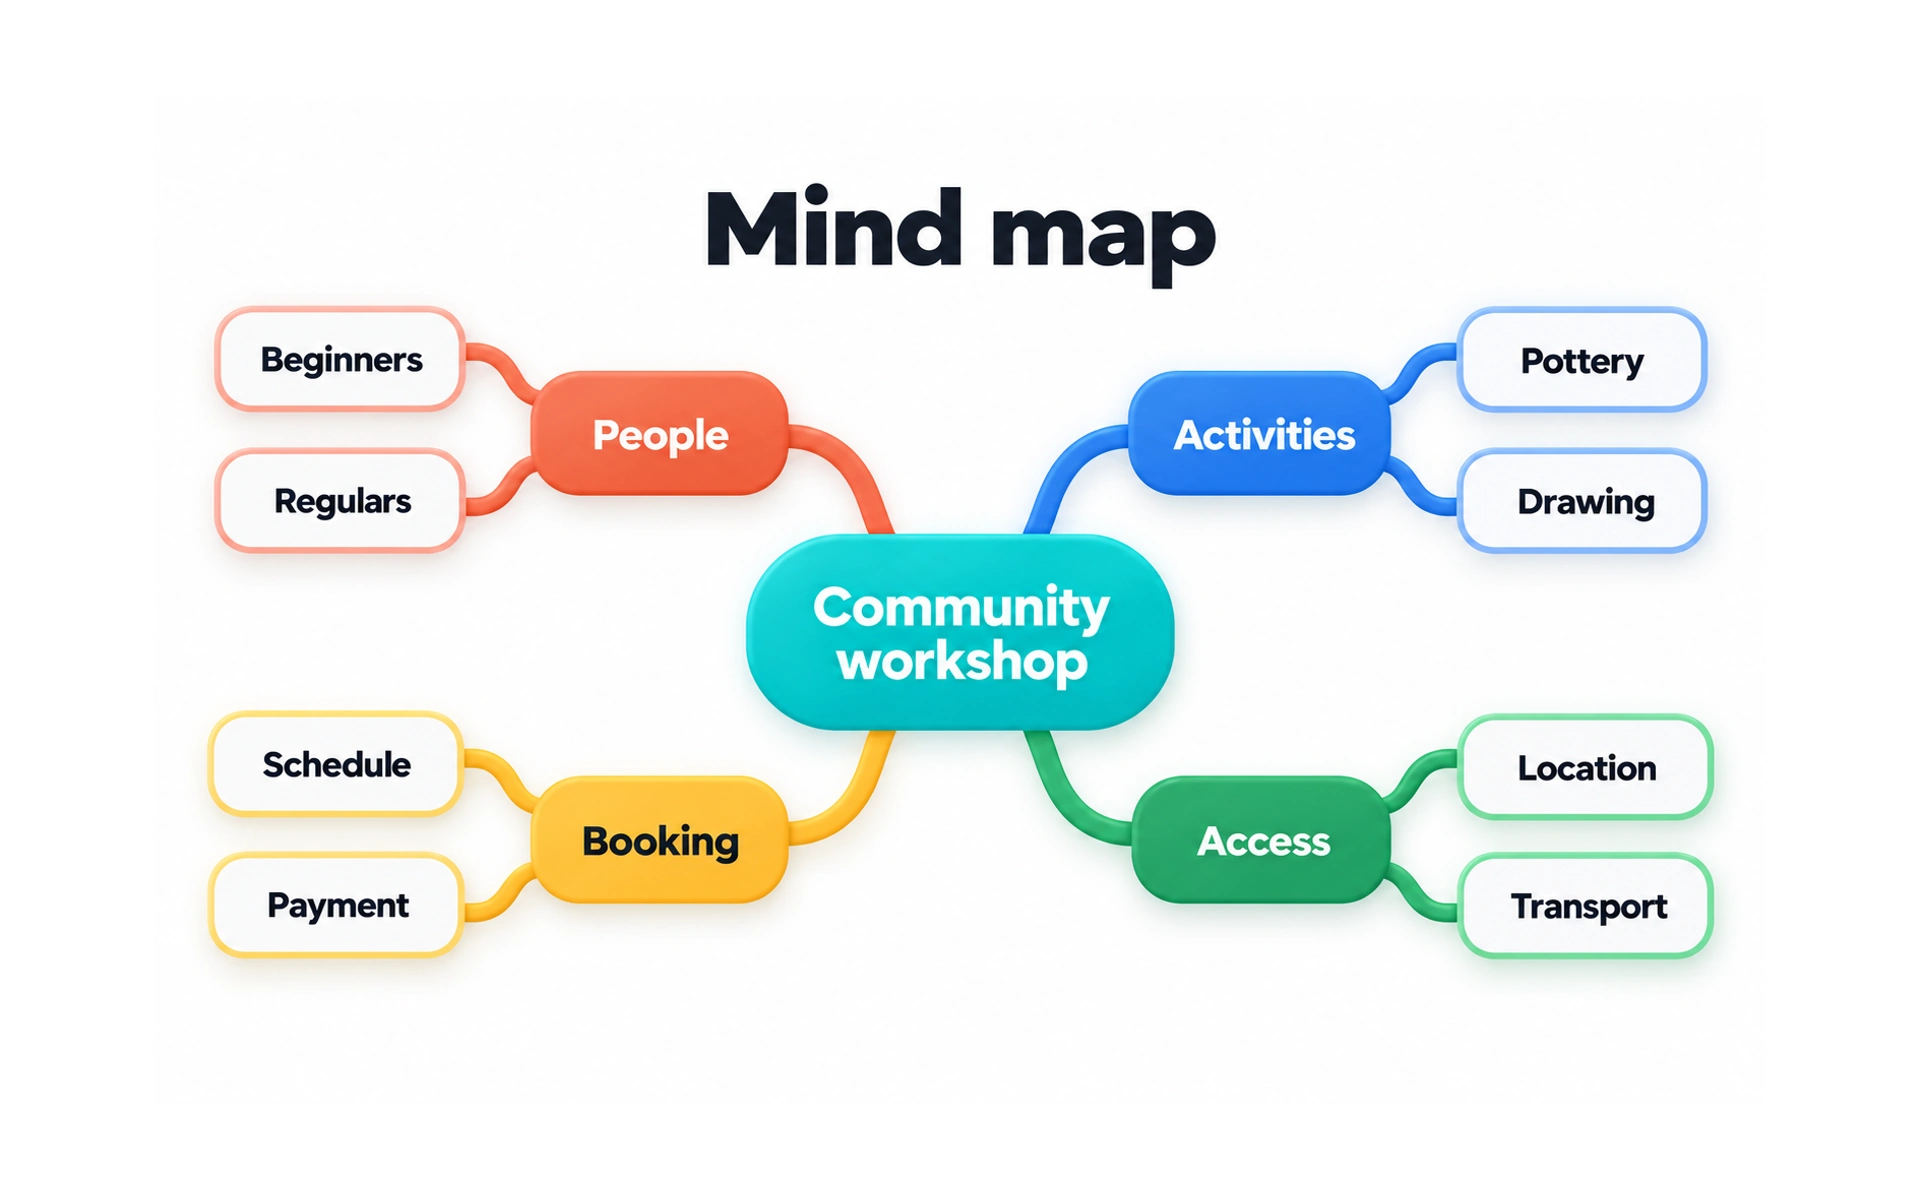
A mind map arranges ideas around one central topic. In the example, "Community workshop" branches into People, Activities, Booking and Access, each with its own sub-topics.
Mind maps are quick to make and easy to change, which makes them great for early brainstorming and for seeing how ideas relate.
They work well as a team exercise, on a whiteboard or in a digital tool, at the start of a project when the scope is still open.
User persona
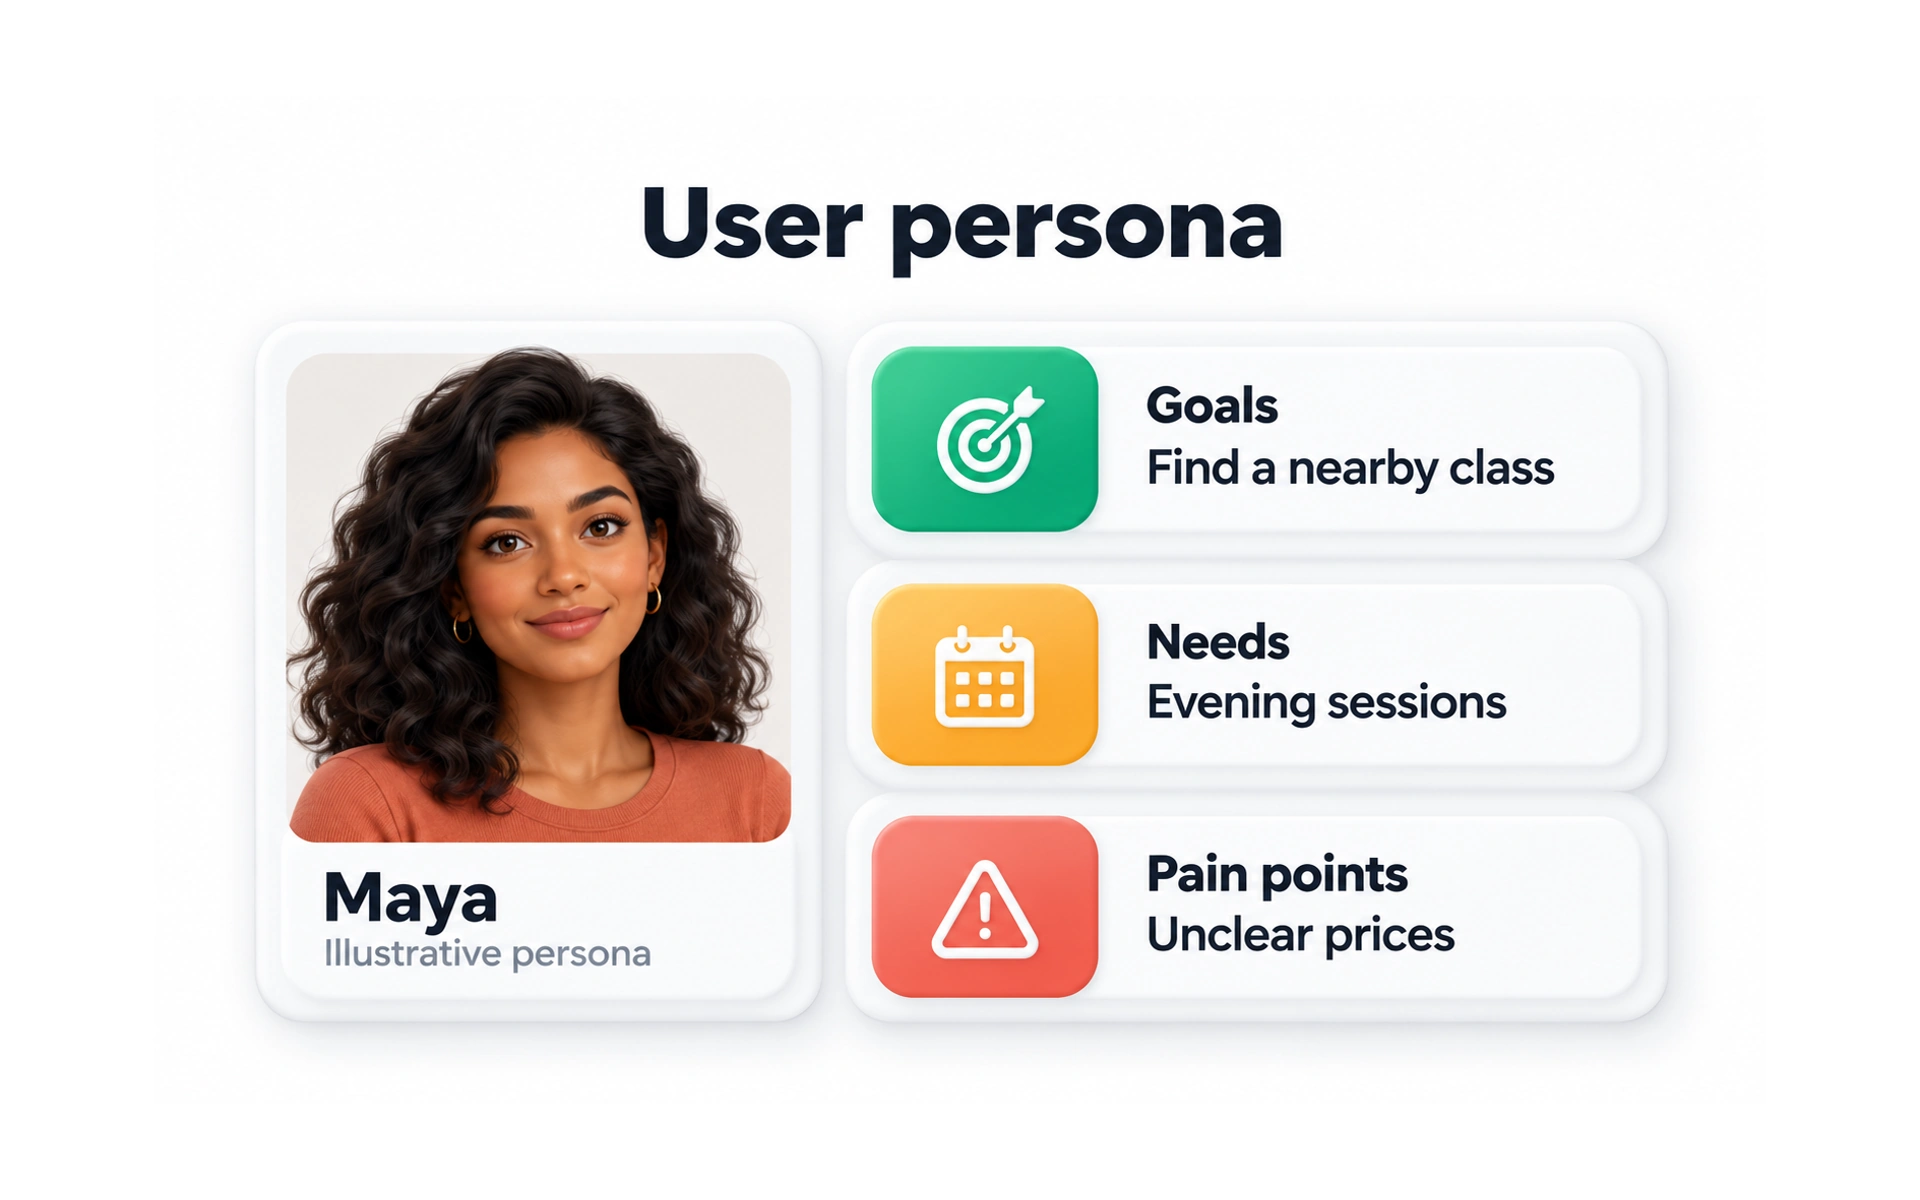
A persona is a profile that represents a group of users. In the example, Maya wants to find a nearby class, needs evening sessions and is put off by unclear prices.
Personas help teams keep real people in mind and make decisions based on their goals, needs and pain points.
A good persona is based on research, such as interviews and analytics. A persona built on guesses, sometimes called a proto-persona, should be treated as an assumption until research supports it.
User flow
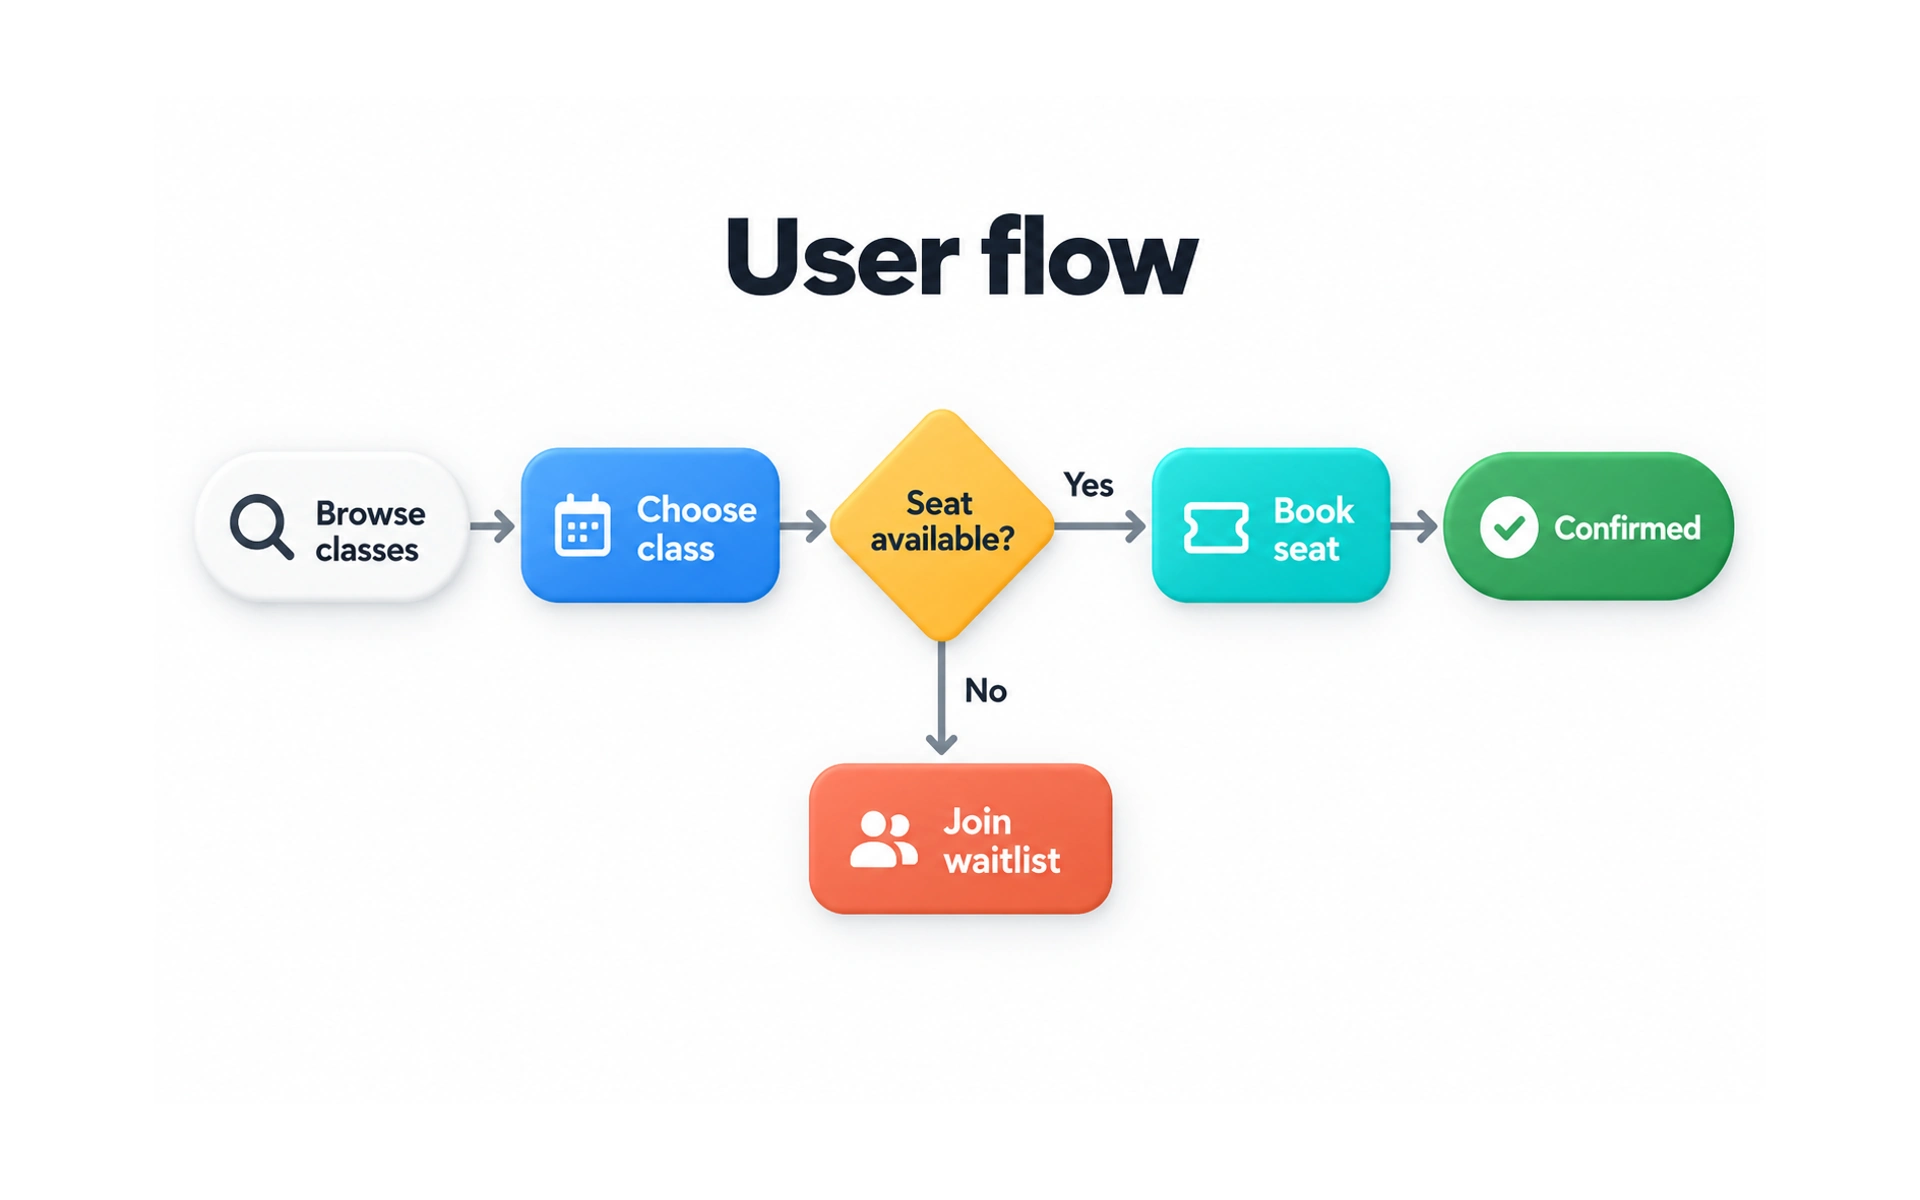
A user flow maps the steps someone takes to complete a task. In the example, a person browses classes, chooses one and books a seat, or joins a waitlist if the class is full.
Flows show the screens, decisions and outcomes in a task, including what happens when things do not go as planned.
Mapping a flow early helps teams spot missing steps and dead ends before they design any screens.
Storyboard
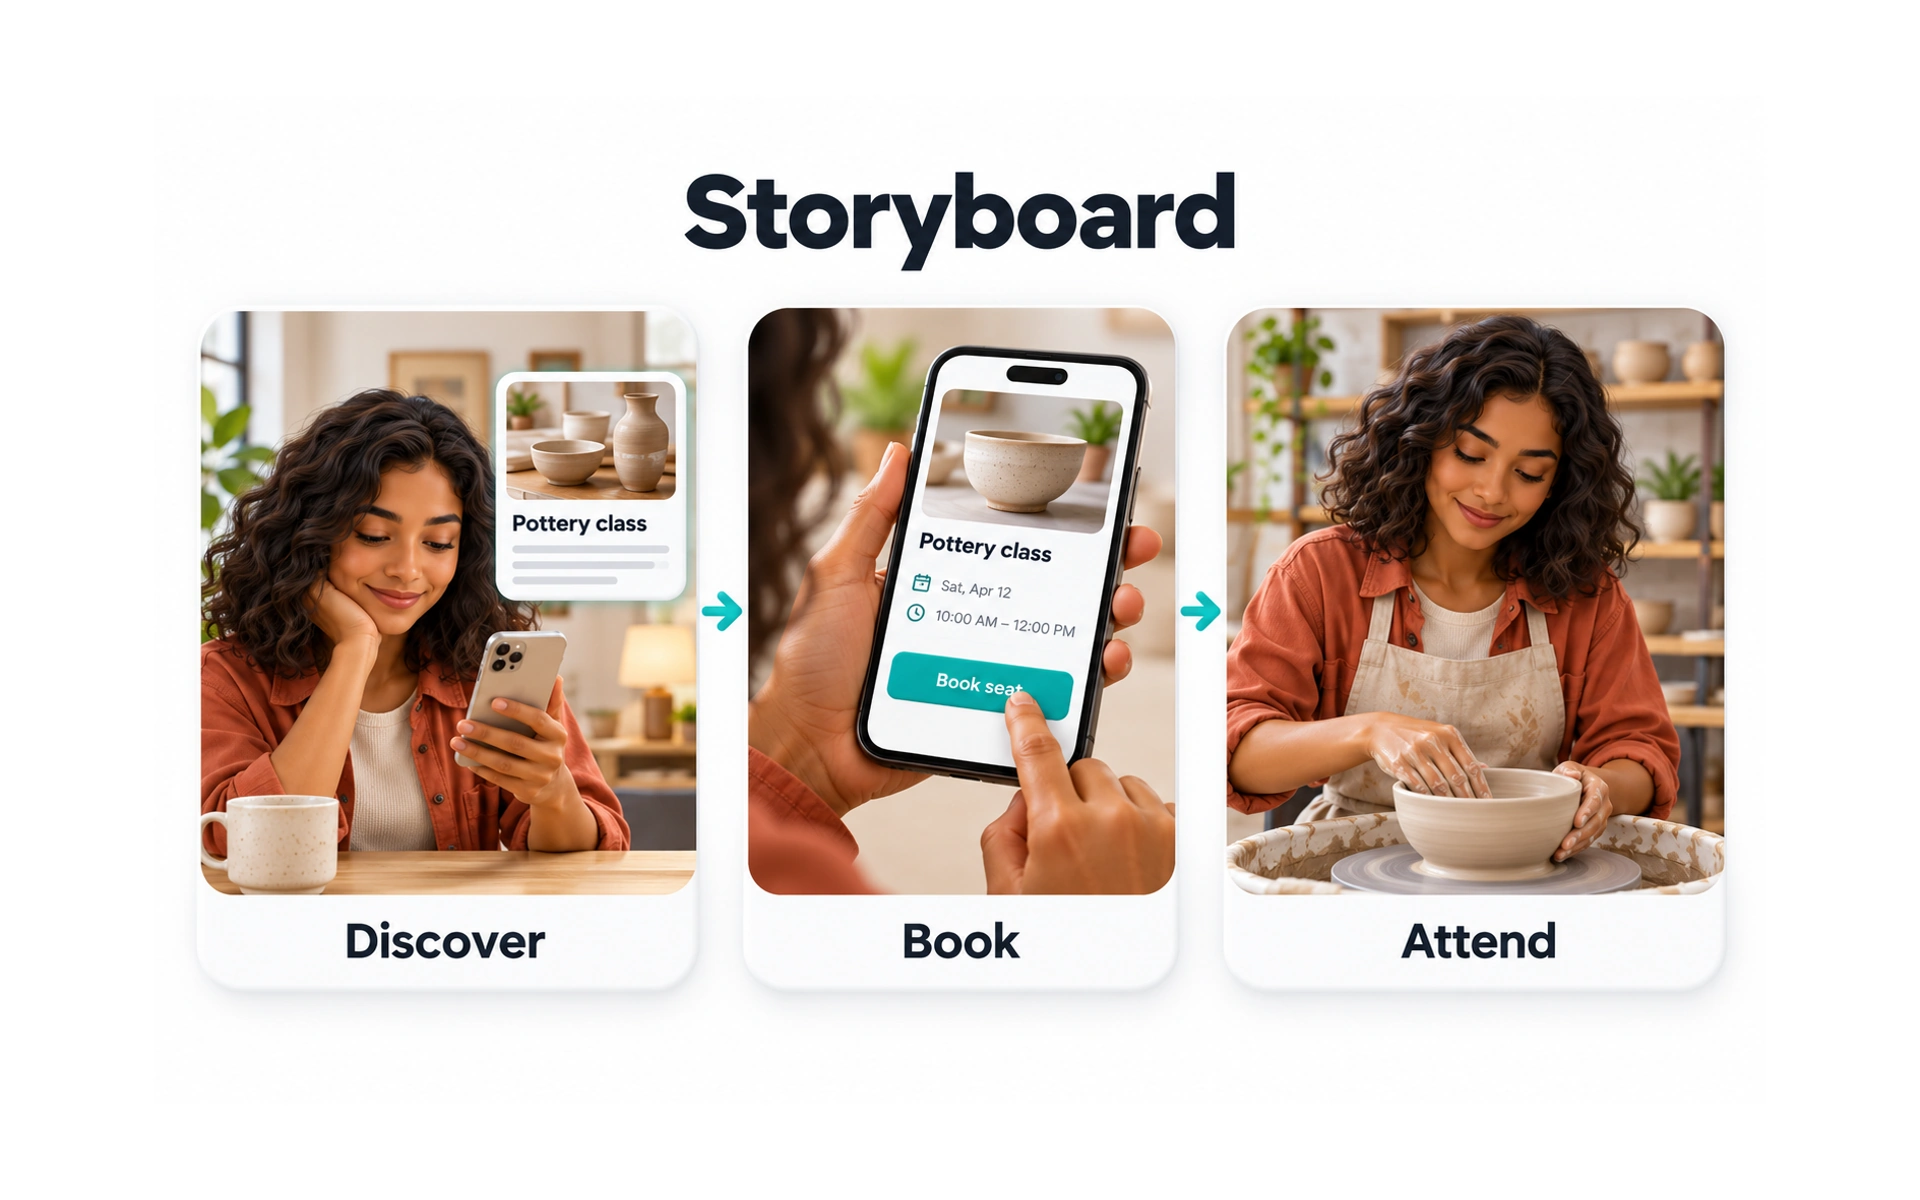
A storyboard tells a user’s story in a few illustrated steps, like a comic strip. In the example, Maya discovers a pottery class, books it on her phone and attends.
A storyboard has three parts: a scenario, a picture for each step and short captions that describe what is happening.
Storyboards show the context around a product, such as where people are and how they feel, which helps the team understand the whole experience.
Customer journey map
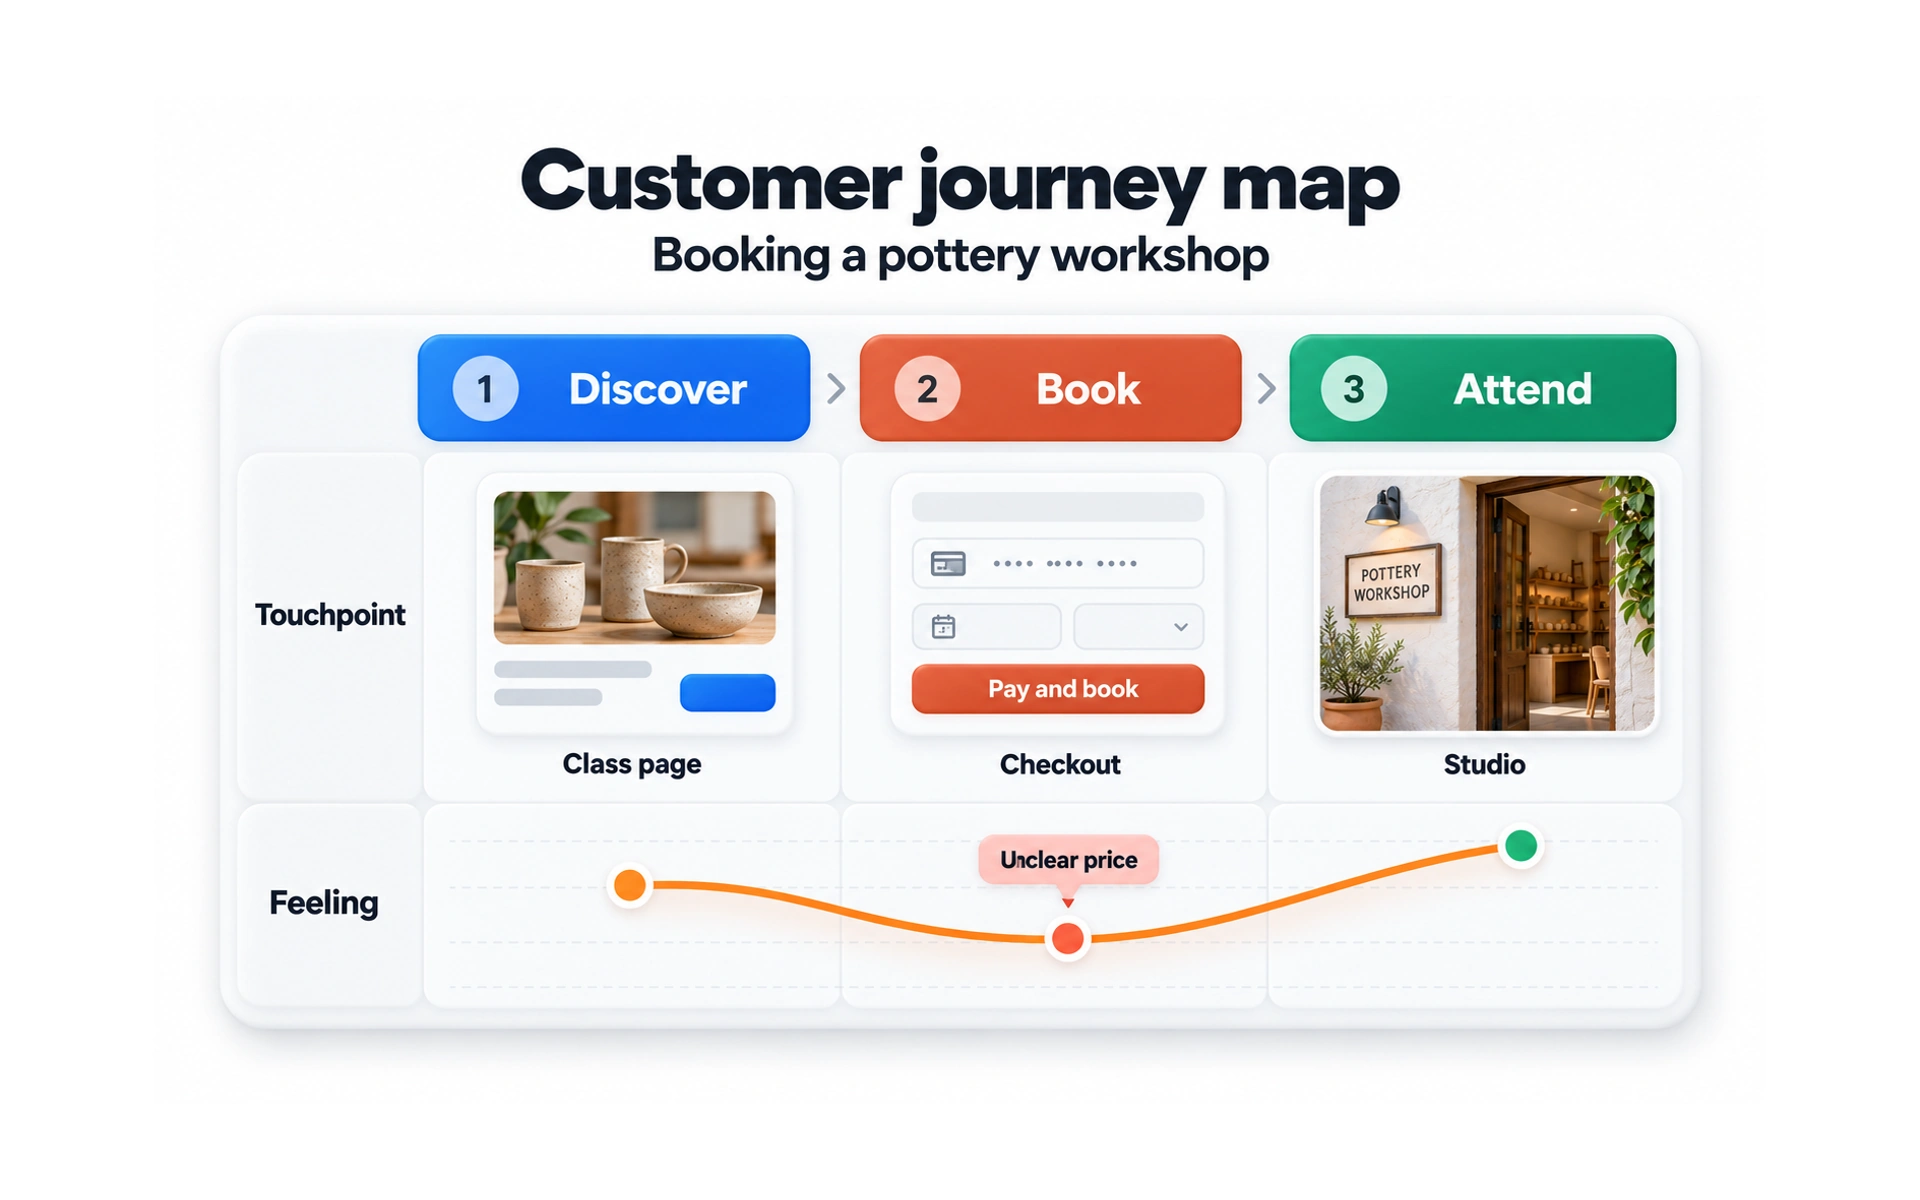
A customer journey map shows a customer’s experience with one product across every stage. The example follows the pottery workshop from Discover to Book to Attend.
For each stage, it shows the touchpoint, such as the class page, checkout or studio, and how the customer feels. Here, an unclear price at checkout is the low point.
Journey maps help teams find the moments that most need improvement. They are strongest when based on interviews and other research.
Experience map
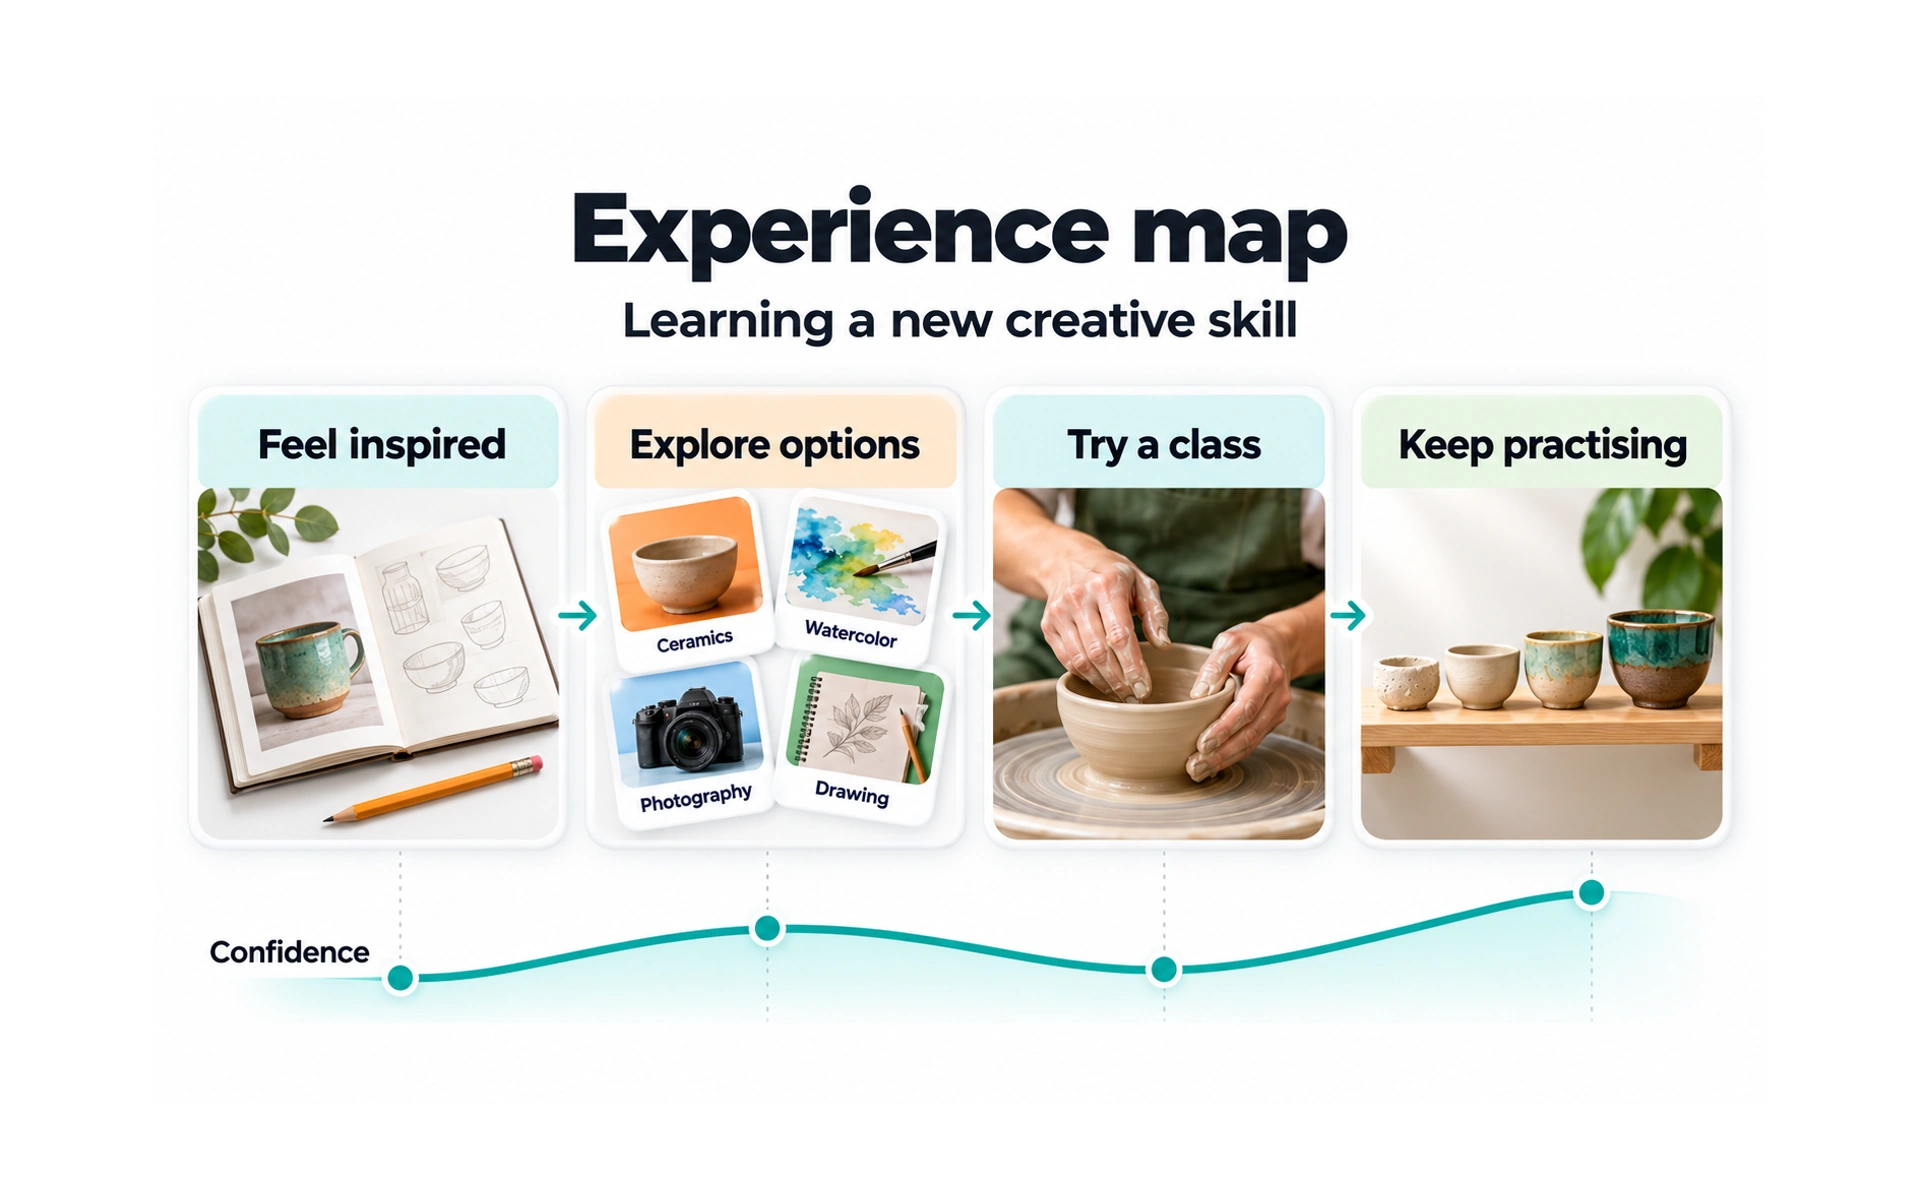
An experience map shows a general human experience, not tied to one product or brand. The example shows learning a new creative skill: feeling inspired, exploring options, trying a class and practicing.
Because it is broader than a journey map, it reveals needs and opportunities that apply across many products.
Teams use experience maps to understand the bigger picture before deciding where their product fits.
Empathy map
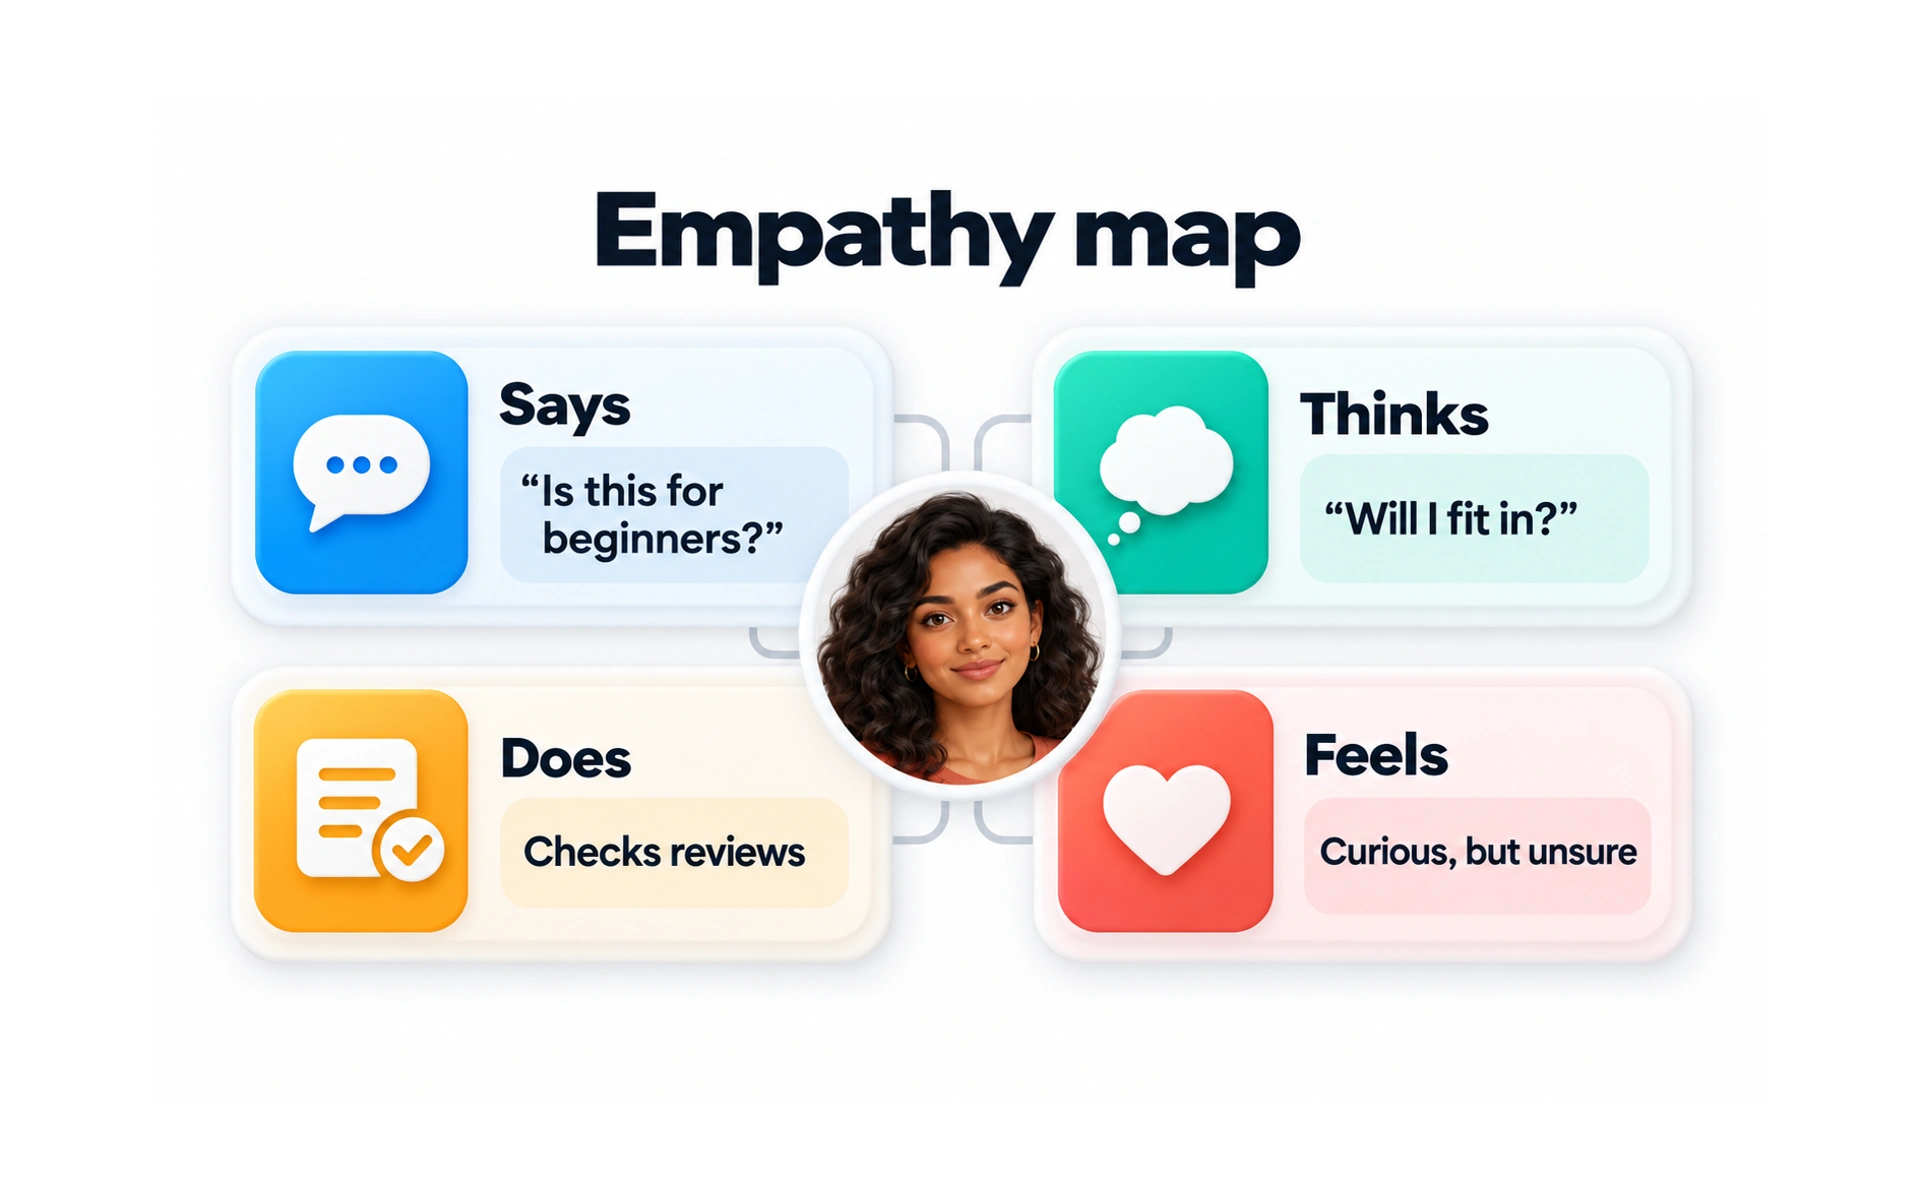
An empathy map captures what a user says, thinks, does and feels. In the example, Maya asks "Is this for beginners?", wonders "Will I fit in?", checks reviews and feels curious but unsure.
The four quadrants help the team see beyond what people say, to what they might be worried about or hoping for.
Fill empathy maps from real research, such as interview notes, rather than guesses.
Service blueprint
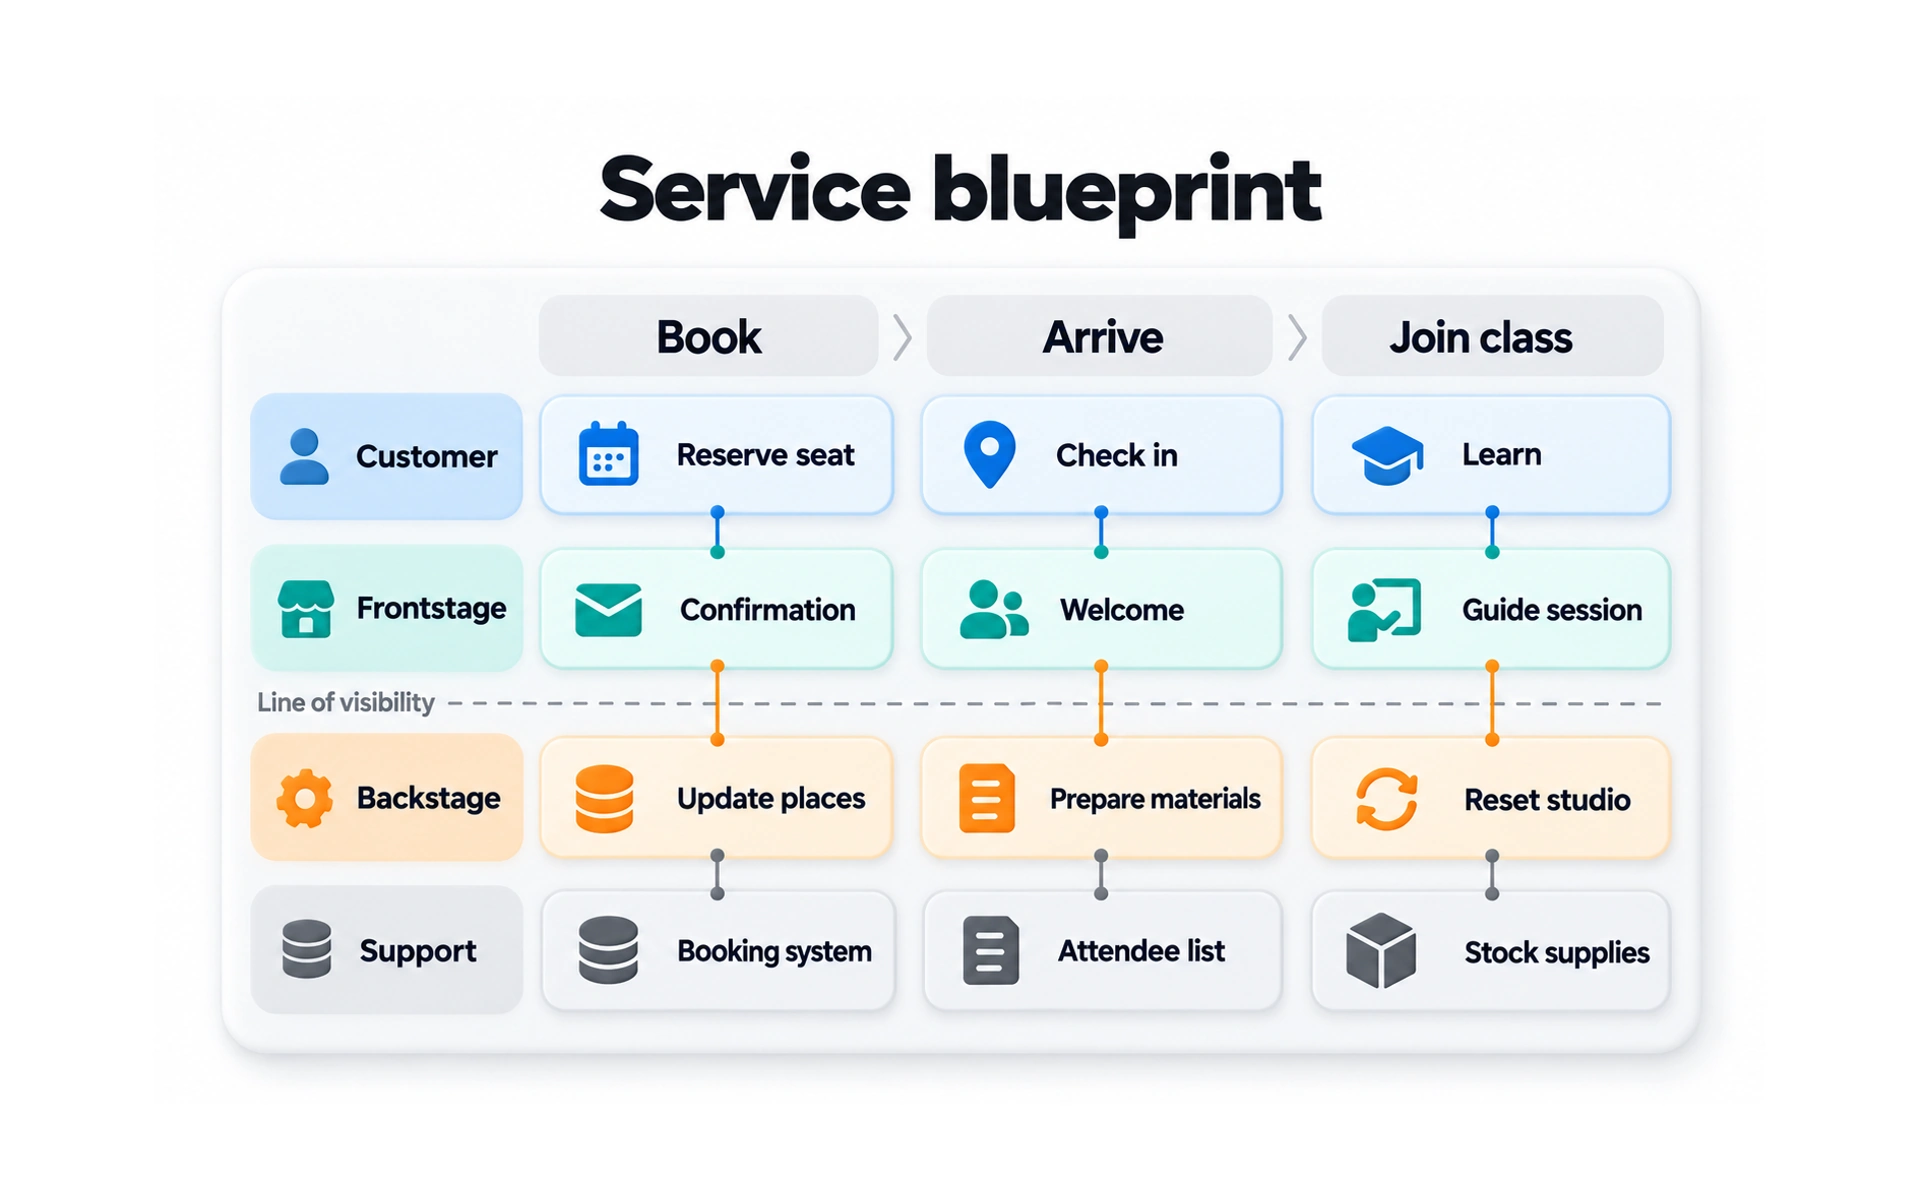
A service blueprint shows everything that makes a service work, both what customers see and what happens behind the scenes. The example follows booking, arriving and joining a class.
Each column is a step. The rows show the customer’s actions, the frontstage staff and screens they interact with, and the backstage work and systems that support them.
The "line of visibility" separates what customers see from what they don’t. Blueprints help teams find gaps between the two.
Site map
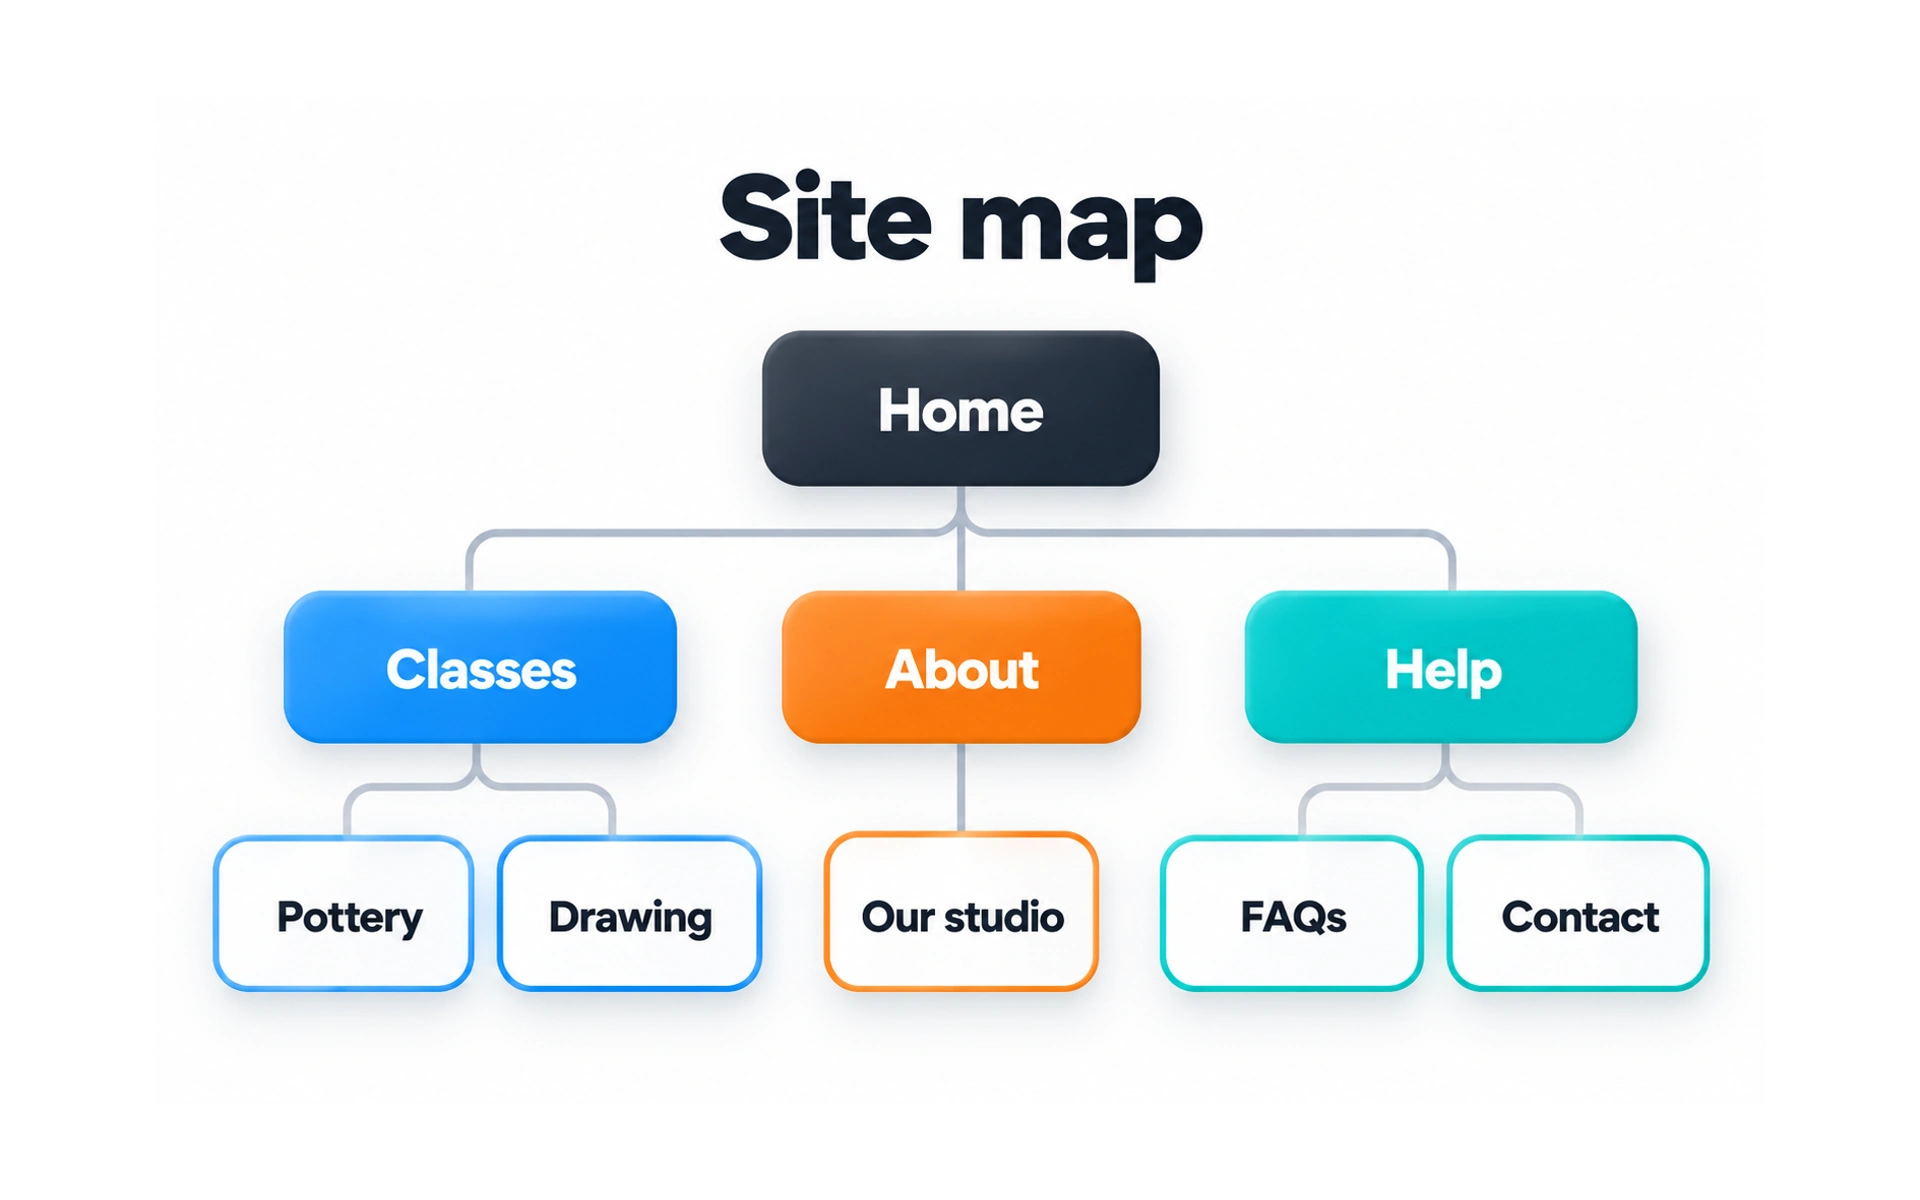
A site map shows how the pages of a website or app are organized. In the example, Home branches into Classes, About and Help, each with its own pages.
It gives designers and developers a shared overview of the structure before they design individual screens.
Base the groups and labels on how users think about the content, for example by running a card sort.
Wireframe
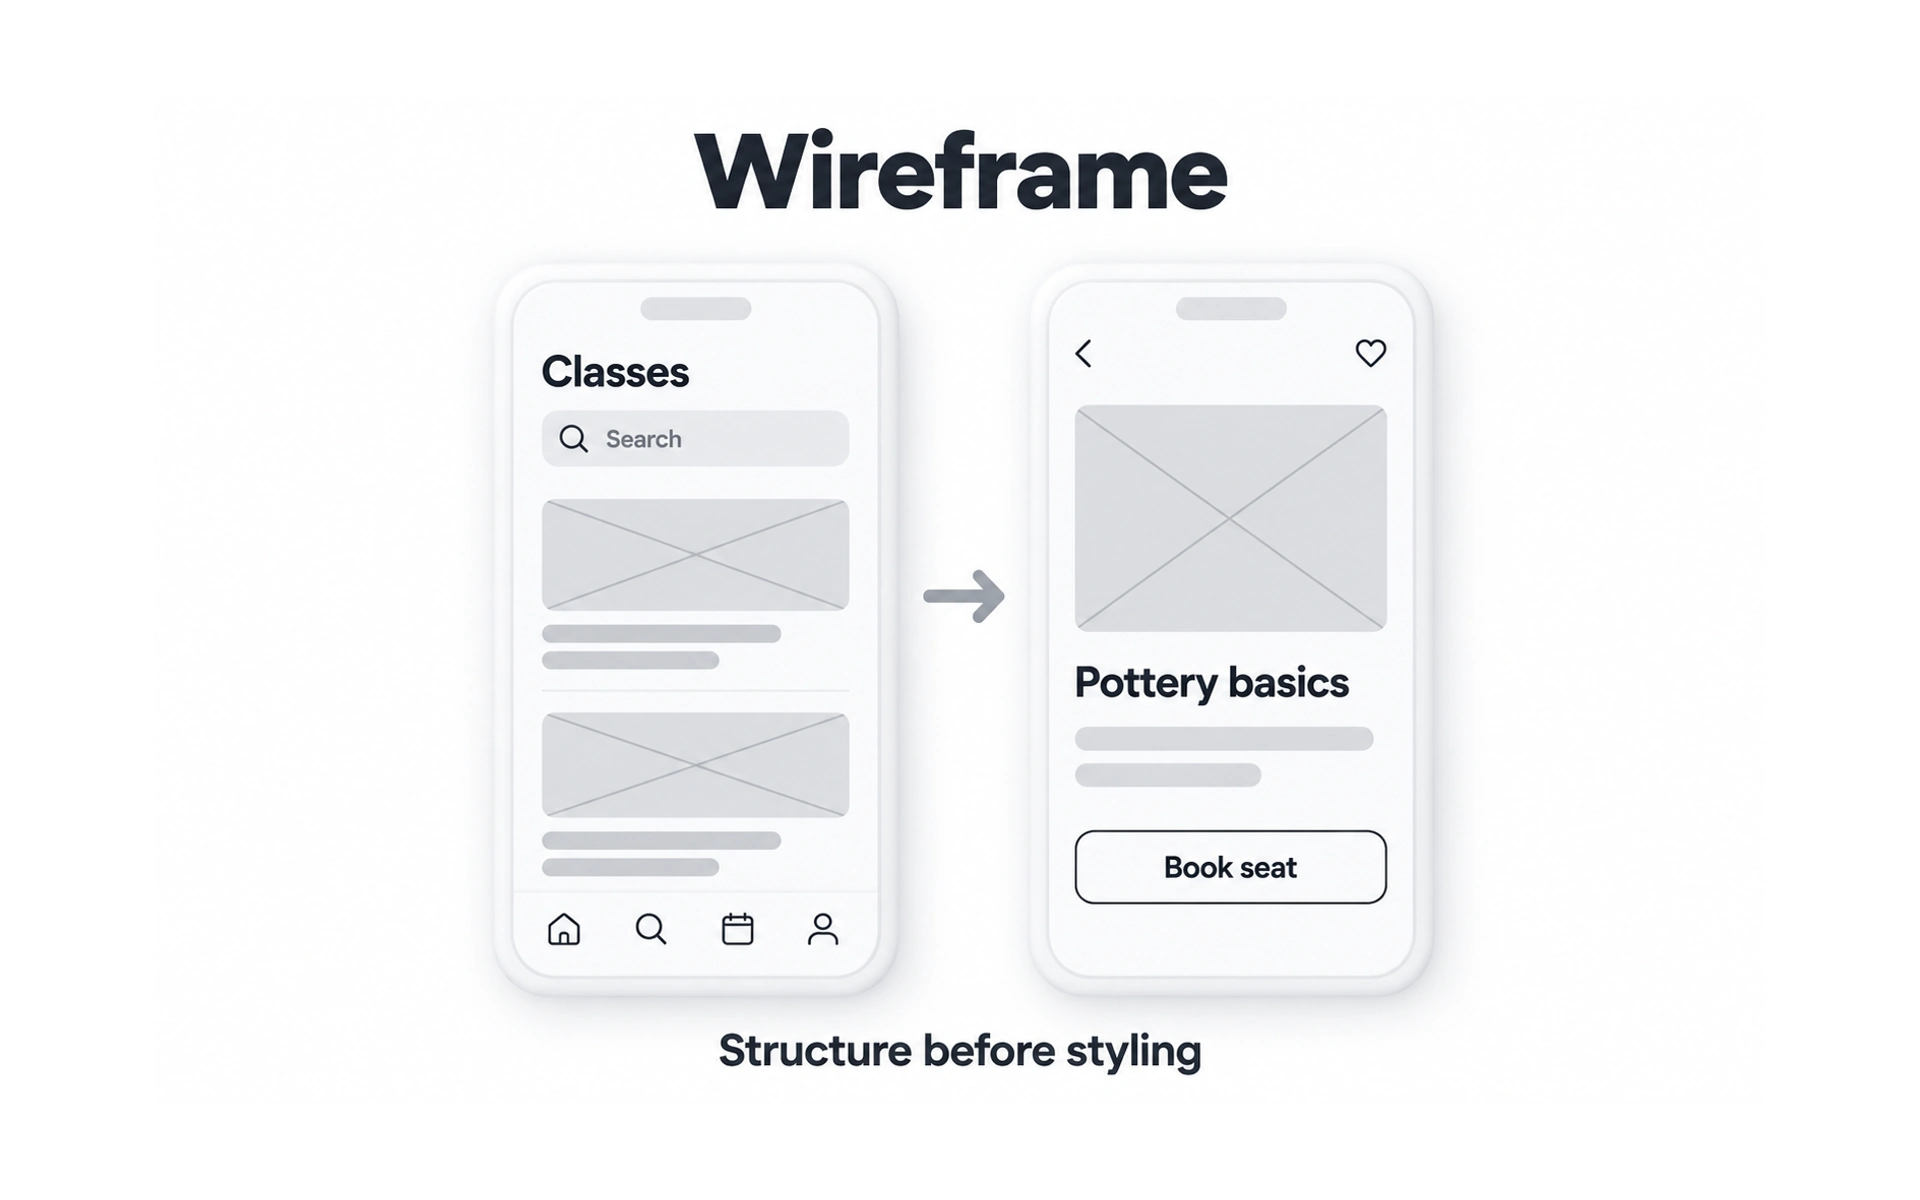
A wireframe is a simple layout of a screen, focused on structure, not style. The example shows a class list and a class page, drawn with gray boxes and placeholders.
Wireframes decide what goes where, such as the search field, images, titles and the Book seat button, without worrying about colors or type.
Because they are quick to make, wireframes are a cheap way to explore ideas and get early feedback.
Prototype
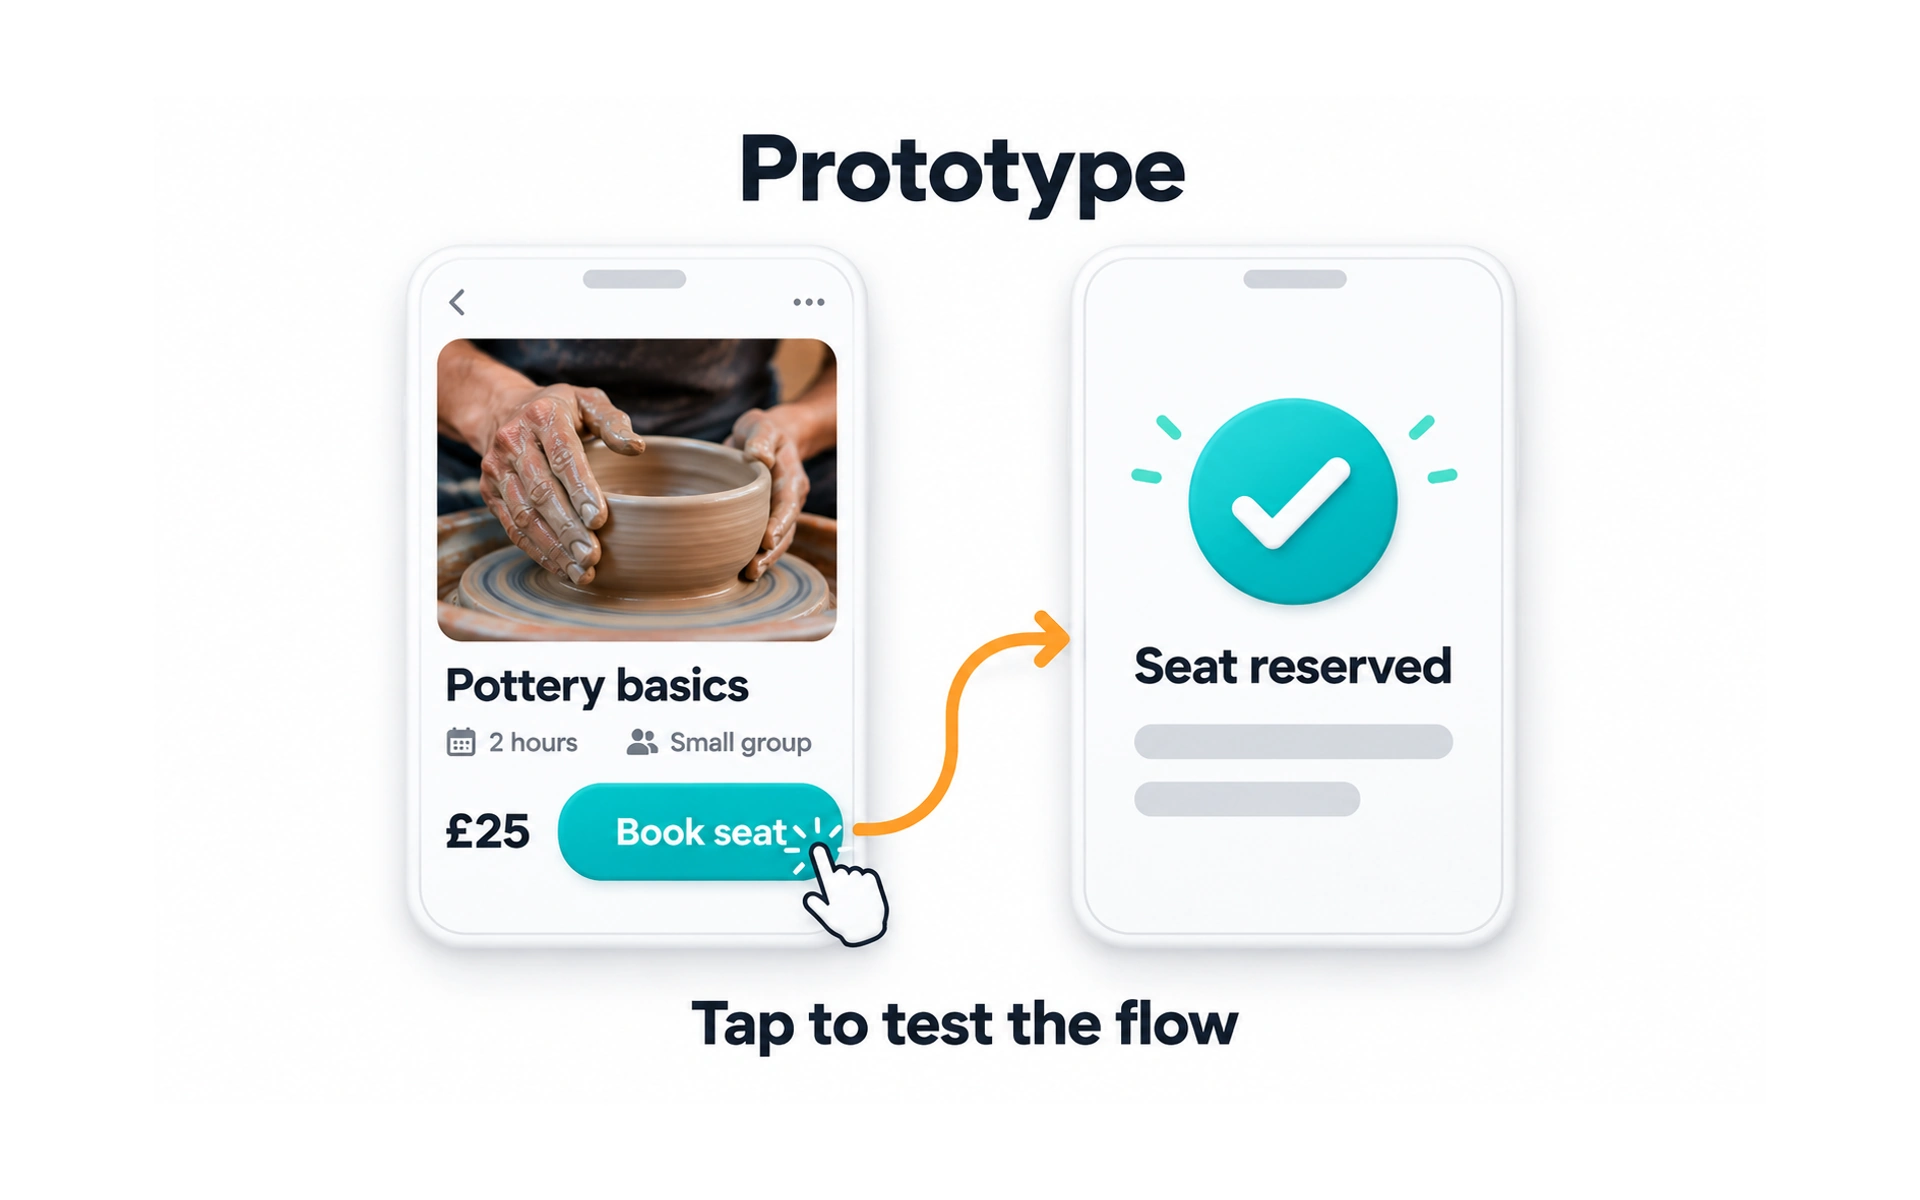
A prototype is a model you use to try out an idea. It can be as simple as paper screens you swap by hand or as detailed as an interactive demo. In the example, tapping Book seat on the class page leads to a "Seat reserved" confirmation.
Prototypes let people try a design before it is built, so the team can test interactions and get realistic feedback.
They range from low-fidelity, such as linked wireframes, to high-fidelity versions that look and feel like the real product. Choose the fidelity that answers your question.
Usability report
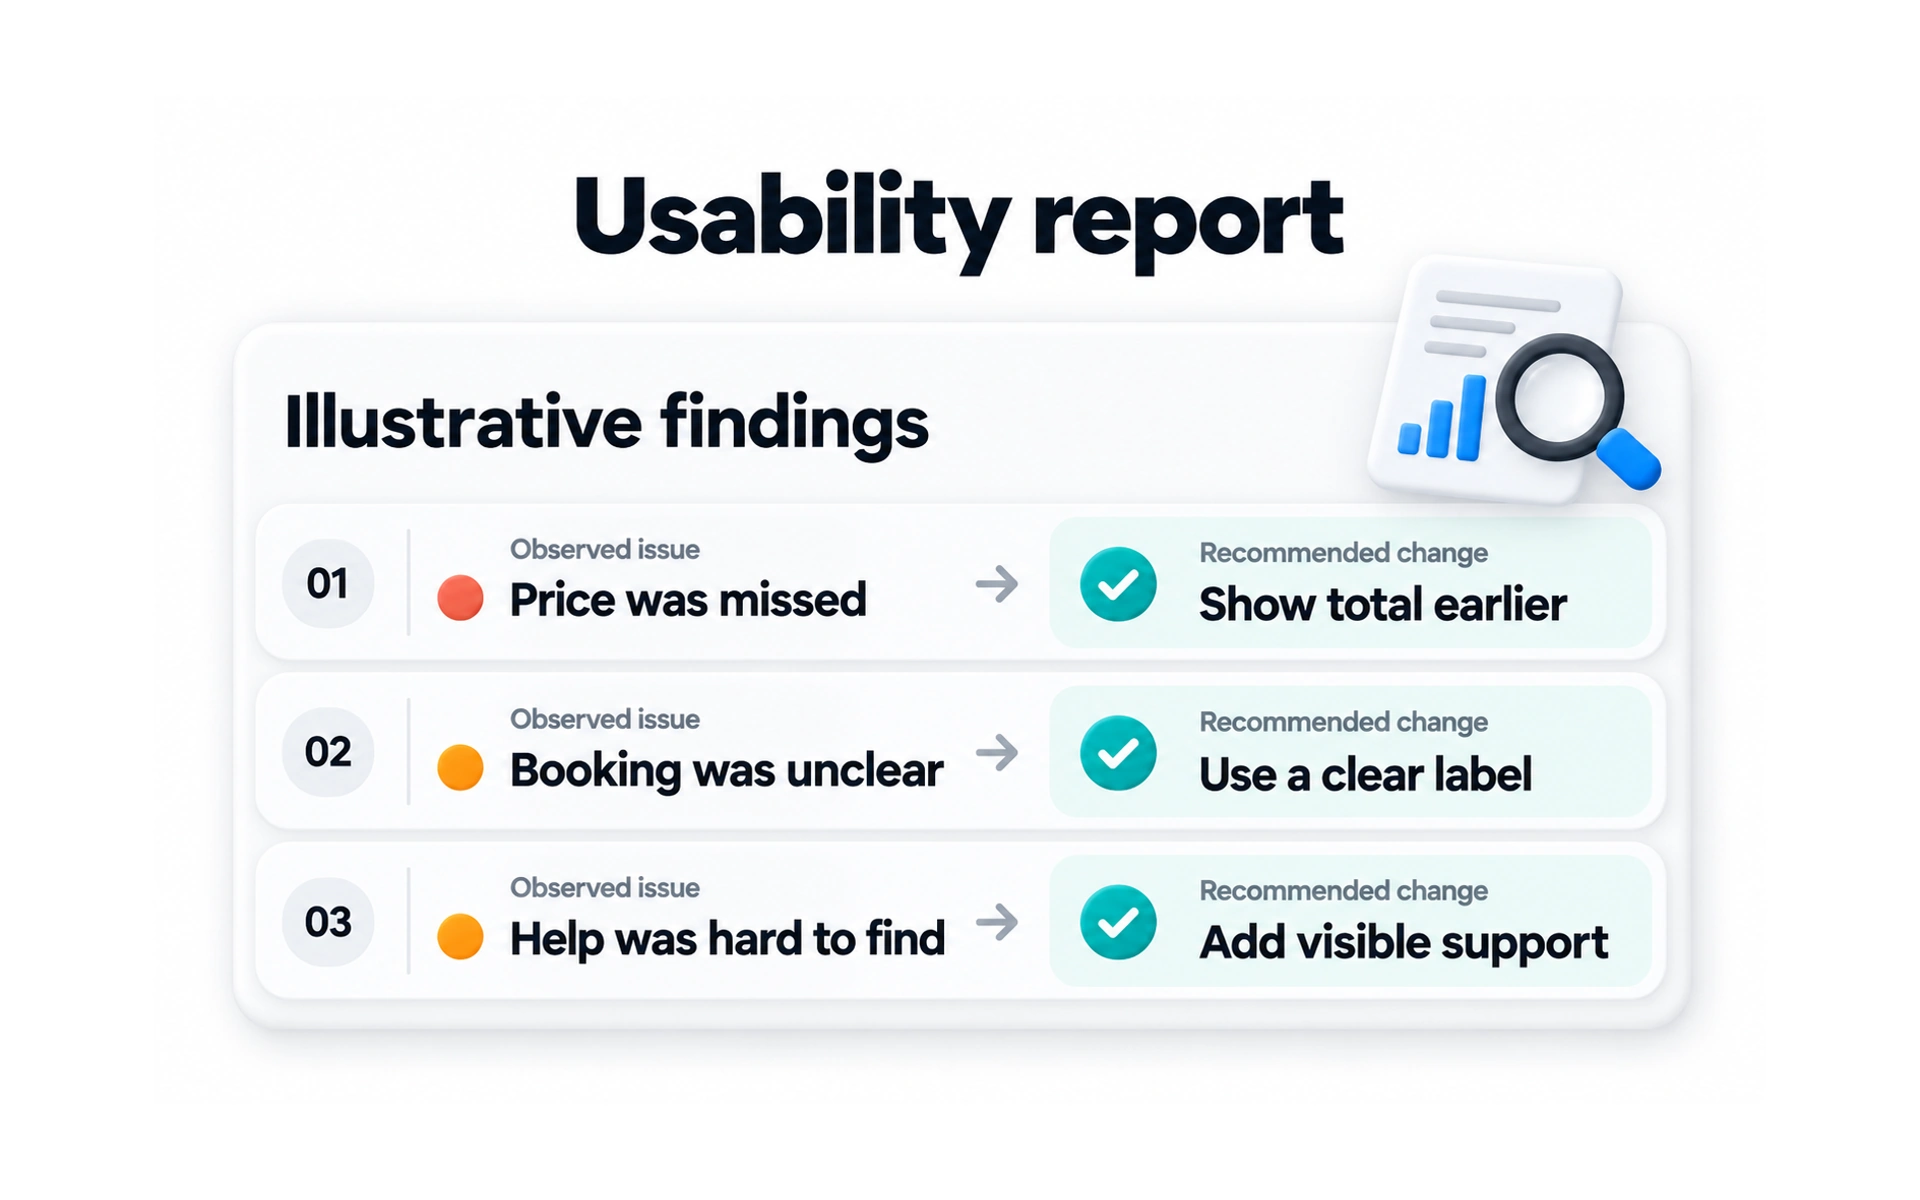
A usability report summarizes what a usability test found. The example lists observed issues, such as "Price was missed", each paired with a recommended change.
A good report describes the tasks, what participants did, the problems found and how serious they are, with clear recommendations.
Reports are read by people in many roles, so keep them short, clear and free of jargon.
REFERENCES
- 1. How To Empathize With Your Users - Usability Geek | Usability Geek
- 2. Storyboards Help Visualize UX Ideas | Nielsen Norman Group
- 3. Using Customer Journey Maps to Improve Customer Experience | Harvard Business Review
- 4. UX Mapping Methods Compared: A Cheat Sheet | Nielsen Norman Group
- 5. Empathy Mapping: The First Step in Design Thinking | Nielsen Norman Group
TOPICS
FROM COURSE